PM Case Study: Oneshot. AI | Part 3 : Growth Expirments
- Gokul Rangarajan
- Apr 6
- 13 min read

Inside a Product Manager’s 12-Month Diagnosis of an AI Sales Tool
This is a multi-part blog of my journey as an AI PM joining Oneshot.ai.
In the previous analysis, we discussed how the data already showed something was off. Users were onboarding, exploring the product, and even generating messages, but not really acting. Activation was weak, and usage wasn’t translating into behaviour. Along with that, we also went deep into user interviews to understand what was actually happening.
The blog series is basically about 9–12 months of working closely with the founder at Oneshot.ai, which eventually helped the company raise $3M+ from 42CAP and scale to $2M ARR, along with running multiple user interviews and product iterations.
This blog is about the growth experiments we ran from Jan 2022 to April 2022.
We didn’t know what would work, so we tested across workflows, behaviours, and executions. We weren’t trying to improve one feature. We were trying to understand where the system breaks. We tested across three layers:
1. improving the message
2. improving the workflow
3 improving behaviour.
Where can we produce a better outcome for the customer?
Up until this point, most of our thinking was still anchored around personalisation. The assumption was simple. If we improve the quality of messages, reduce friction, and make it easier to personalise them, users should act more. The interviews had already started to challenge this assumption, but we hadn’t fully let go of it. These experiments were the bridge between what we thought was true and what actually held under pressure.
We didn’t run these experiments one after another. We ran them in parallel.
With less than 12 months of runway, the concern from Venki and Gautham was not about experimentation itself but about wasting time without clear returns. The shift happened when we reframed the situation. We showed that activation, usage, and conversion were already flat, so continuing on the same roadmap was not a safe option but a slow failure. Instead of proposing new features, we positioned the initiative as problem discovery, where each experiment was a small, low-cost way to understand what actually drives action. We emphasised that these were not long bets but fast cycles with clear success metrics, so we would know within weeks what worked and what didn’t. The key argument was simple: if we don’t validate the hypothesis now, we risk spending most of our remaining runway solving the wrong problem. Understanding SDR as an individual, process and community was the ke; that's what aligned both Venki and Gautham to commit to running these growth experiments. In the first phase, we tested three different directions at the same time, each targeting a different layer of the problem. The idea was not to optimize one path but to see which layer actually moves behaviour. This mattered because everything looked like a surface issue. Low activation could be onboarding. Low usage could be UX. Low conversion could be messaging. But underneath all of this, there was a deeper question. What actually makes an SDR act?
Message Layer :Reducing Effort vs Reducing Thinking
“By the time I reach the 40th or 50th message, I’m just trying to finish the list.”
We started with the most obvious layer. The message.
From interviews, one pattern was clear. SDRs believed in personalisation, but they didn’t practise it consistently. They didn’t lack intent. They lacked time and continuity. They would start the day with the intention to personalise, but by the time they reached their 40th or 50th message, it became about speed. The system they operated in rewarded volume, not depth. This created a gap between what they said and what they did.
So we focused on reducing effort.
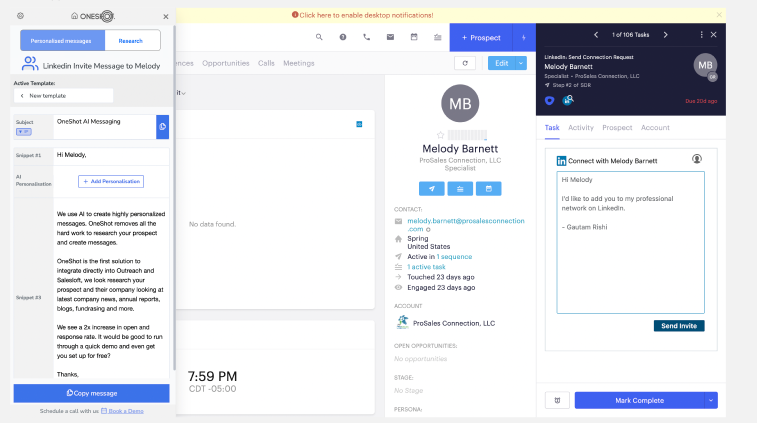
Experiment 1 — Inline Personalization (Friction Removal)
The first set of experiments tried to remove friction in how messages were created and used. Instead of asking users to generate a message and then copy it into their workflow, we started bringing the message closer to where action happens. We experimented with inline personalisation, where the generated message appeared directly inside the sending interface, whether it was email or LinkedIn.

The goal was straightforward. If the message is already there at the moment of action, users don’t have to think or switch contexts. They can just review and send.


The message send rate increased ~8–12% on Day 1, but dropped to baseline by Day 7
D1 → D7 retention fell from ~40% to <10% for this feature
Time sent was reduced by ~20–25%, but total messages sent per user didn’t increase
Repeat usage remained low (<15% users used it again after Day 3)
No meaningful impact on conversion or reply rates
That’s where the contradiction showed up.
We had reduced friction. We had improved speed. We had embedded the product inside the workflow. But behaviour didn’t change.
The assumption we were operating under was that effort was the problem. But this experiment showed that effort was only a surface layer. Even when the message was right there, users still hesitated. They still paused. They still defaulted back to their usual way of working.
One SDR put it clearly:
“It’s helpful, but I still end up tweaking or second-guessing before sending.”
Another said:
“Even if it’s there, I still have to think if this is the right message.”
That hesitation was the real signal.
It wasn’t about where the message appeared. It was about the mental step that still existed before sending. Users weren’t avoiding personalization because it was far away. They were avoiding it because it required a decision.
Experiment 2 : Full Message Generation (Thinking Removal)
We had 15 days to pivot and develop a new experiment. The next step was not about reducing steps but reducing thinking. From the previous experiment 1, it was clear that even if the message was placed inside the workflow, users still paused before sending it. The problem was not access or speed. It was a one-step thinking decision required before action. So instead of assisting users in writing messages, we moved to generating full messages upfront.
The system now produced a complete, ready-to-send message as soon as the user opened a prospect.
The system now produced a complete, ready-to-send message as soon as the user opened a prospect, where the message was not generic but custom-built based on the prospect’s recent activity, company context, and role-specific signals, mapping directly to potential pain points they might be facing and clearly linking it to the product’s value proposition, creating a natural connection between what the buyer is likely experiencing and what we are offering. There was no need to think about structure, what to include, or how to phrase it. The only action left was to review and send, with an option to tweak if needed. The goal was simple. If we remove the need to think, users should act more consistently.
Time to first action reduced significantly, and users started sending messages faster within the same session.
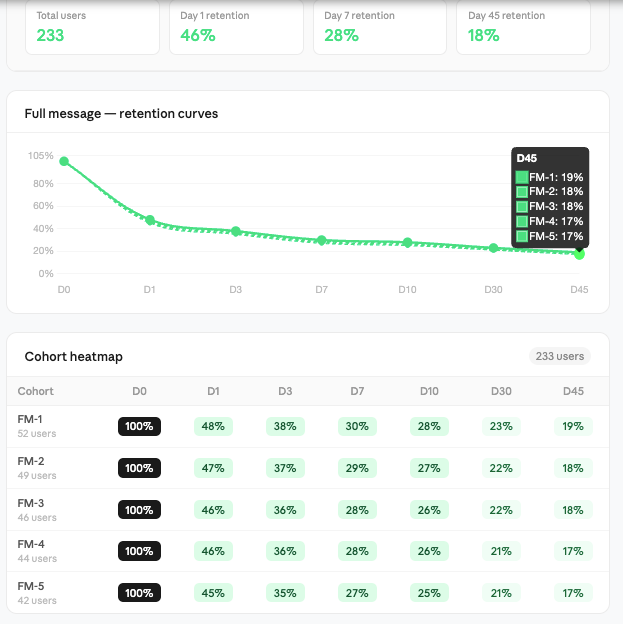
D1 to D7 retention improved to ~25–30%, compared to <10% in inline personalisation.
Repeat usage increased (30–35% of users continued using it after Day 3). Messages sent per user increased slightly (~10–15%), but not proportionally to speed improvement. Reply rates saw marginal improvement, but not significant enough to drive overall outcomes. At first, this looked like a clear improvement.
Users were no longer stuck in the writing phase. The interaction shifted from thinking to reviewing. The cognitive load reduced, and the action felt lighter. For the first time, we saw signs of habit formation, not just trial usage. But even here, something was incomplete. Users were sending messages faster, but the system still relied on them deciding who to reach out to and when. The message was no longer the bottleneck, but the decision before the message still existed.
One SDR described it simply:
“This saves time, but I'm still not 100% confident. Is this the right account to right prospect, and to figure out who I should send this to?"
Another said:
“The message is fine, but I’m still not sure if this is the right person or the right time.”
That’s where the next layer of the problem became visible.
We had reduced friction. We had reduced thinking inside the message. But we hadn’t touched the decision outside it. And that’s where the focus started shifting from message to workflow.
Experiment 3 : Hot Leads
This experiment was run in the first phase (initial ~15 days), in parallel with message layer experiments, focusing on the workflow side.
From interviews, we saw that a large part of an SDR’s time goes into deciding who to reach out to. So we introduced a “Hot Leads” layer that identified high-intent prospects based on signals like hiring, funding, recent activity, or role changes. These leads were surfaced inside the product as a prioritized list, helping users focus on prospects more likely to respond.
We initially built an enrichment pipeline with GPT parsing layered on top of scraped LinkedIn and web data, using backend jobs to extract hiring, funding, and activity signals and map them to a unified prospect schema. As we scaled, we integrated APIs like 6sense and ZoomInfo for structured intent data, then moved to an in-house pipeline using SERP APIs with scheduled crawlers, entity resolution, signal scoring models, and a real-time ranking layer to prioritize leads.


Message send rate increased ~5–8% on Day 1, but dropped back to baseline by Day 7D1 → D7 retention stayed low (~15–18%), with no meaningful improvement over baselineTime spent on prospect selection reduced slightly (~10–15%), but didn’t translate into more actionsRepeat usage remained moderate (~20% users checked signals but didn’t act consistently)No significant impact on conversion or reply rates.
Experiment 4 : Hot Leads + Action Integration (Closing the Loop)
This experiment was run in the second phase (next ~15 days), after we saw that Hot Leads as a signal layer was not enough. From the previous experiment, it was clear that users valued the signals but didn’t act on them. The problem was not identifying the right leads, but converting that insight into action. So instead of just showing hot leads, we integrated them directly into the execution flow.


The idea was to reduce the gap between knowing and doing by eliminating extra steps and decisions. The product shifted from highlighting opportunities to pushing users toward action. This is where we saw a clear shift in behavior.
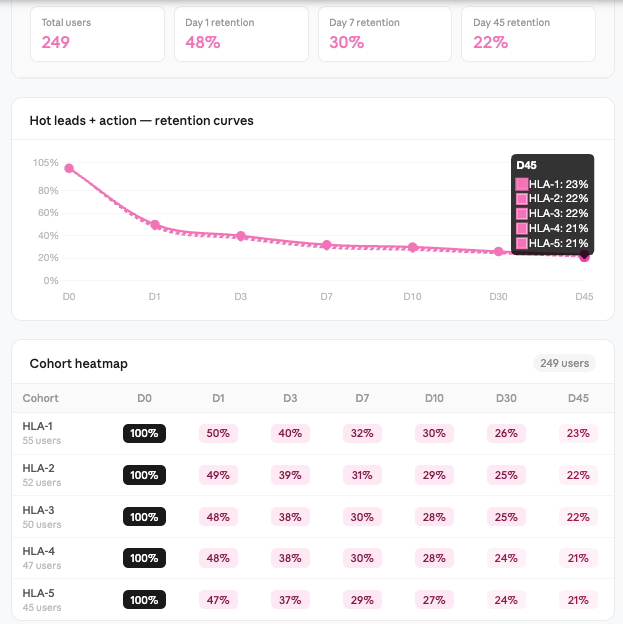
The interaction moved from browsing to execution, and the feature started becoming part of their daily workflow rather than an optional layer.
Experiment 5 : Research + Context Panel (Structured Thinking Layer)
Like the previosu one this growth experiment was run in the second phase (~next 15 days), alongside workflow improvements, to address a gap we were still seeing.
From earlier experiments, we had reduced friction in messaging and improved action through workflow integration. But users still struggled with what to look for when emailing , Linkeidn invite and personalizing. Even with signals and full messages, there was still a mental step where users had to understand the context before trusting or modifying the output.
So we introduced a research and context panel.

The idea was to eliminate tab switching and guide users on what inputs matter for personalization.

The feature was useful. Users engaged with it, especially during initial exploration. But it behaved more like a support layer than a driver of action. It helped users who were already motivated, but didn’t push new behavior on its own.


Message generation increased slightly (~8–10%), but no strong impact on send rateD1 → D7 retention remained moderate (~18–22%), with no major lift over baselineTime spent per prospect increased (~15–20%) due to deeper context explorationRepeat usage was stable (~25–30%), but not tied to higher action ratesNo meaningful improvement in conversion or reply rates
Experiment 6 — Reporting (Awareness Layer)
This experiment was also part of the second phase (~next 15 days), focusing on the behavior layer.
From earlier experiments, we had improved parts of the workflow and messaging, but one pattern was still consistent. Users knew personalization was important, but they didn’t do it consistently. The gap was not capability, but behavior under pressure.
when we interviewed them they calimed most do personalisation, bu they never did , they want to do , but cant is what we aseuemd So we introduced a reporting layer to make this visible.

The product started showing users their own personalization behavior how many messages were actually personalized, what type of personalization they were using, and where they were falling short.

We also added simple benchmarks and improvement suggestions to show what “good” looks like.

The idea was to create awareness. If users could see the gap between what they think they are doing and what they are actually doing, they might correct it.
From a UI perspective, this was shown as in-product summaries and periodic reports, highlighting performance and gaps in a simple, digestible format.
Users engaged with it.
They opened the reports, checked their numbers, and understood where they stood. But the behavior didn’t change consistently.
The feature informed users, but didn’t drive action on its own.
Feature engagement was high (~45–50% users viewed reports at least once)D1 → D7 retention remained moderate (~20–25%), with no strong improvementNo significant increase in message send rate or personalization consistencyRepeat usage dropped after initial curiosity (~20–25% continued after Day 3)No measurable impact on conversion or reply rates
We extended this reporting beyond the product by sending periodic email summaries to SDRs and their managers, highlighting personalization gaps and performance trends. These were also used as part of internal weekly reviews, where teams discussed outbound quality and areas of improvement. The idea was to tie insights to real conversations and create accountability through existing processes. While this increased visibility and discussion, behavior change still depended on follow-ups and manager intervention. By the third phase, this started evolving into a more structured feedback loop as the product matured.

Experiment 7 — Scoring + Manager Layer (Accountability Loop)
This experiment came in the later part of the second phase and into the next cycle after 30 days , building on top of reporting.
From the previous experiment, it was clear that awareness alone was not enough. Users understood their gaps, but behavior didn’t change unless there was external pressure. So we extended the system from awareness + accountability.
We introduced an outbound scoring layer that quantified user behavior across multiple dimensions personalization depth, message quality, subject effectiveness, and consistency.

The data was used in weekly reviews, follow-ups, and performance discussions. The idea was to make outbound measurable and tie it to accountability. From a product perspective, this shifted us from being a tool to being part of the operating system of the team.
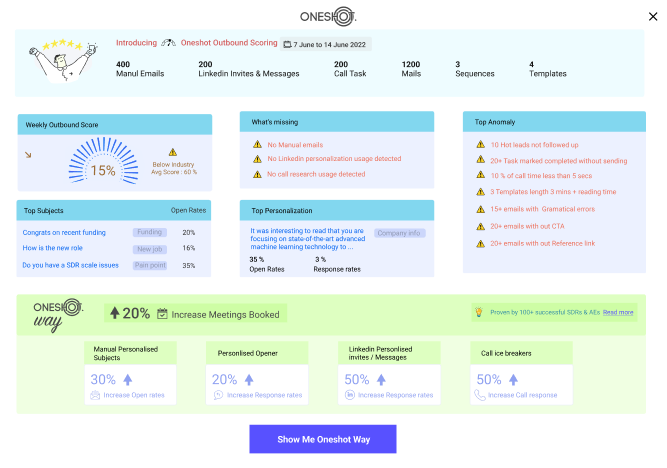
Managers started using the data to guide conversations, identify gaps, and push improvements. Users paid attention because the metrics were now visible beyond just themselves.

But even with this, behavior change was not automatic. It improved in teams where managers actively enforced it, but in others, it remained passive. The system created pressure, but didn’t fully remove the effort required to act.

Manager engagement increased (~50–60% teams used dashboards in reviews)D1 → D7 retention remained similar (~22–26%), no strong product-driven liftSlight improvement in personalization consistency (~10–15% in enforced teams)Repeat usage depended heavily on manager follow-ups (~25–30%)Limited direct impact on conversion without workflow integration.
Conclusion
Across all experiments, one pattern became clear. SDRs don’t lack tools. They lack time, clarity, and continuity. They spend most of their time on prospecting, sequencing, and execution. Personalization exists, but only in fragments. At best, a few messages in a day are actually personalized. The rest are driven by speed. Even when they want to do better, the workflow doesn’t support it.
They don’t sit and research deeply for every prospect. At most, they spend a few minutes scanning context, and even that drops as volume increases. Calls, follow-ups, and targets take over.

Each experiment revealed one part of this system.
Inline personalization showed that reducing friction doesn’t change behavior. Full message generation showed that removing thinking improves usage and there is need in better meesaging but doesn’t solve decision-making. Hot leads showed that knowing who to reach out to is useful, but not enough. Hot leads with action showed that connecting insight to execution drives behavior. Research panel showed that context helps, but too much thinking slows users down.Reporting showed that awareness doesn’t translate into action.Scoring showed that accountability works, but only with external pressure. Individually, each experiment solved a small part of the problem.But none of them solved the system.
The real problem was not message quality. It was everything around it.
Who to reach out to.When to reach out.What to say.How to act without slowing down.
And most importantly, how to do all of this without requiring constant decisions from the user.
[(ICP + Account Selection) × (Signals + Research Engine)]→ [(Personalization = Pain + Value) × (Channel + Timing)]→ (Scaled Execution)→ (Qualified Pipeline Growth)
or

AccountsAccountsAccounts = Named Accounts
SignalsSignalsSignals = Intent (hiring, funding, activity)
RsR_sRs = Scaled Research Layer
gives Right List
VpV_pVp = Value Proposition
PpP_pPp = Pain Point Mapping
CCC = Channel (Email, LinkedIn, Call)
TTT = Timing / Sequencing
EsE_sEs = Scaled Execution (automation, throughput)
(Right Who)×(Right What)×(Right When)×(Scale)=Pipeline Growth
In the following blog, we’ll break down how we evolved this into an analytical SDR platform that consistently generated 5–10 qualified meetings per SDR each month. The focus shifts from experimentation to building a repeatable revenue engine. We’ll cover how signals, research, and execution were combined into a single system that removes manual effort. Instead of optimizing parts of the workflow, we designed a system that controls the entire outbound process. That’s what turned experimentation into a predictable pipeline.


Comments